A lesson I am proud of is my license plate data activity, intended for a Statistics classroom.  It worked out well for me, as a course introduction, to discuss the course syllabus the same time I was discussing this ongoing project.  It would be practical as well to use this as an end-of-course project to assess a combination of objectives from the Statistics repertoire. 

The project exploits our state's license plate formatting, with three digits and three letters separated by a space (pre-2009 and post-2009 swapped orders with one another), as shown in photos below.  
Picture
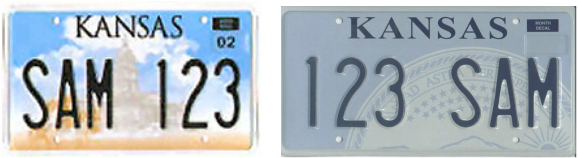
pre-2009 (at left) and post-2009 Kansas standard license plate sample artwork.


 My students' first class assignment was to come return on the second day of class with 50 randomly-collected 3-digit license plate numbers from Kansas vehicles. This prompt was addressed later in the course when we discussed sampling types as an example of quota sampling.

As the course progressed, students were able to comprehend the project requirements, but I felt that giving them the project rubric and instruction sheet (last used for a course in Summer 2010, f.y.i.) with those terms included prior to investigating them in class gave them a first glance at some of the terminology to be used in the near future.  When I started discussing those topics in lecture, they had already heard it and treated the class discussion as if we'd already had it.

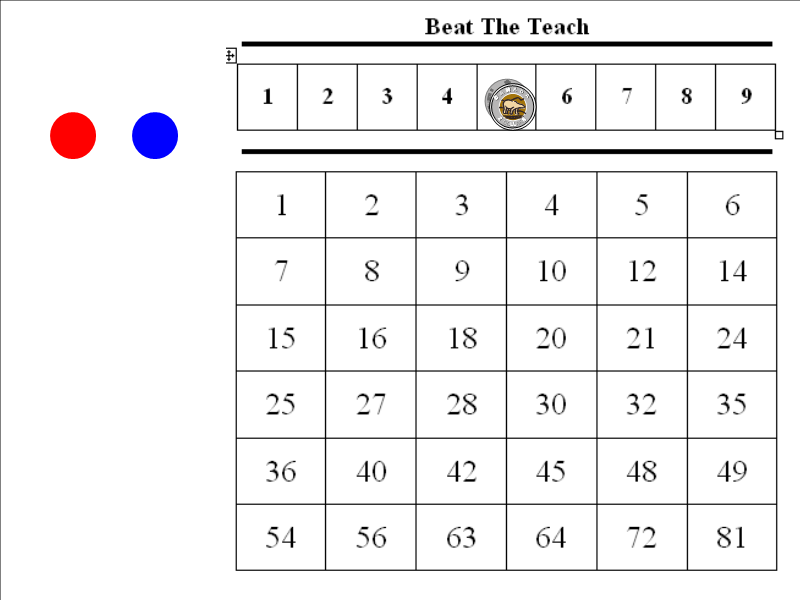
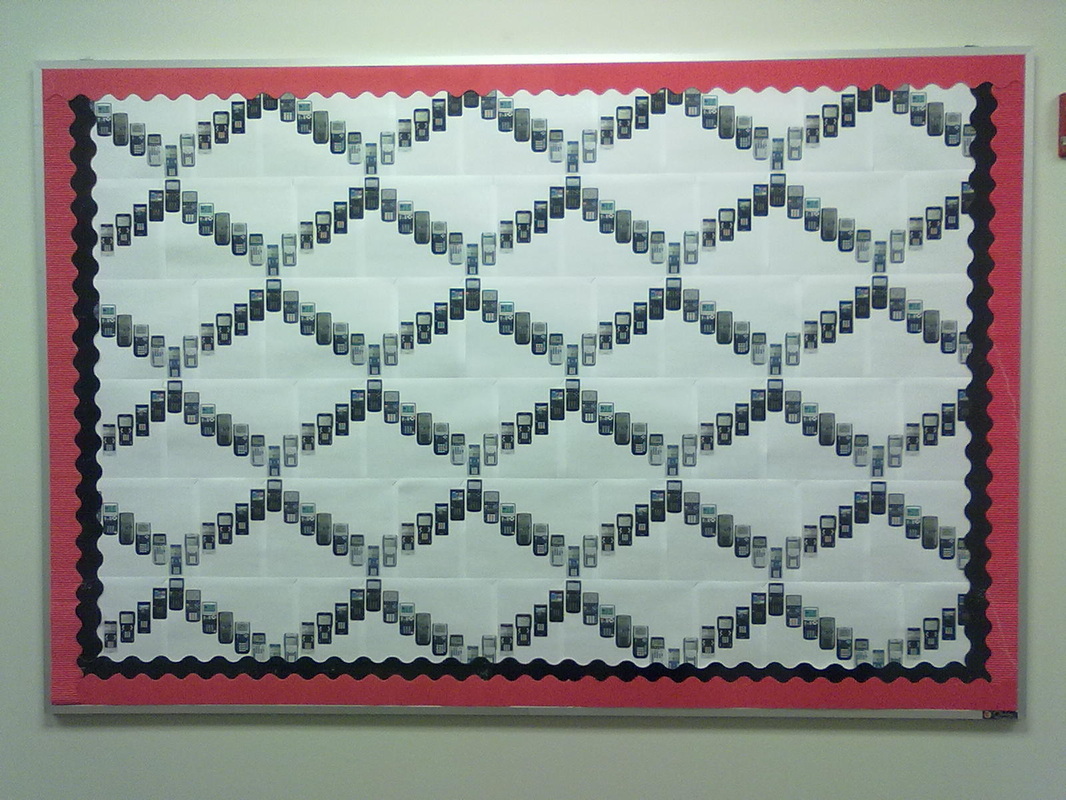
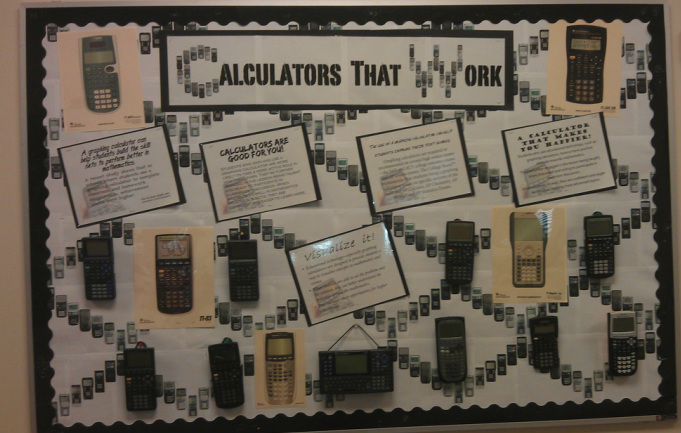
Potentially overwhelming to students was the fact I made a demonstration to show the incorporation of all the required elements of the project in one place.  This created something they could refer back to later in the course, as well as a measuring stick for them to see how their display(s) compared with mine.  See the artwork below.
Picture
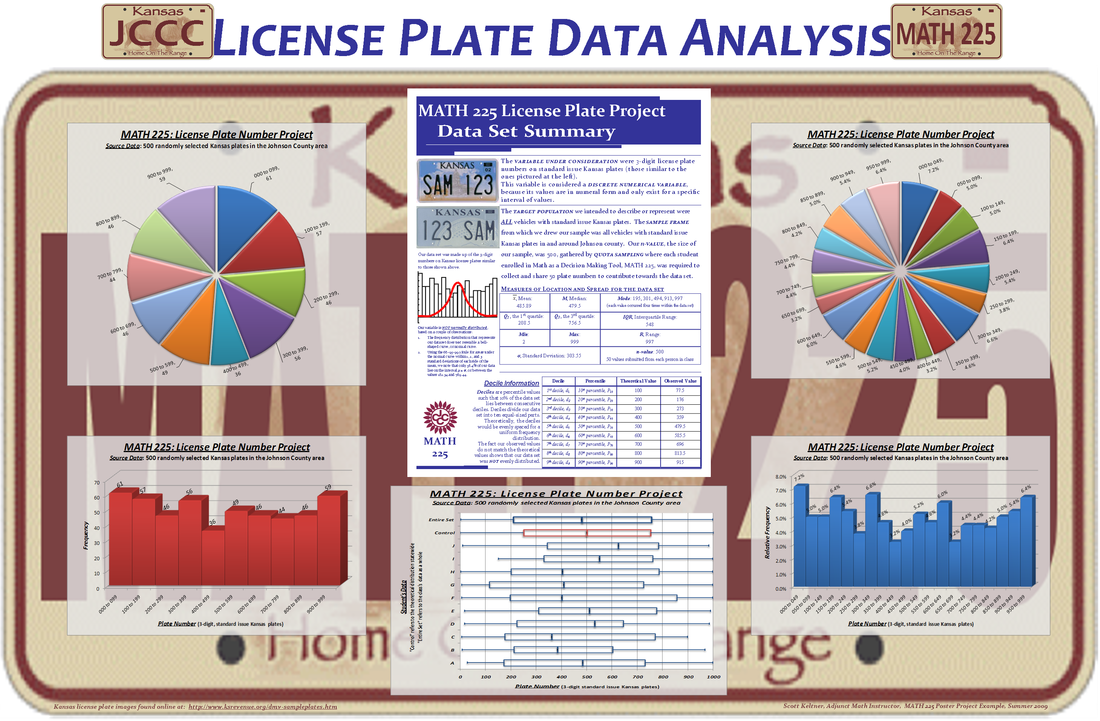
This shows the demonstration version of the final product I showed students to indicate required elements of the project.
Part of the reason I like to submit this among my #Made4Math comrades is that I was able to score a sweet deal on foamboard at a hobby store early on in a summer semester when I taught the course where this project was assigned.  I provided each student with a piece of 20-inch by 30-inch foamboard to level the playing field from day one.  Some students handwrote all elements of their project on the board, others printed individual elements out and glued them to the board, and one (a graphic design major) created his entire project in Photoshop and took the file to Kinko's to have the whole thing printed to fit the foamboard, then rubber cemented into place.  To each their own.

Along with the list of required information students had to include with their poster display, there were three other elements described, of which they were to choose TWO to include on their own project.  They were:


     Histogram Hysteria:  A frequency histogram AND relative frequency histogram for the data set
  • These displays must be separate graphs (not just a matter of re-labeling the vertical axis), but include an appropriate title and labels for each axis.
  • The displays must have different values for the class intervals (i.e. one histogram done with class intervals of 50, the other with class intervals of 100, or a similar way of distinguishing the data).  Keep in mind that class intervals typically categorize our data into somewhere between 5 and 20 classes.
     Passing Pie Fancy:  TWO circle graphs/pie charts, similar to the histograms above, with different class intervals and different values for each class.
  • One graph could show the percent of the sample that made up each category; the other could show the frequencies for each category.
  • The graphs must have different class intervals.
     Boxplot Breakdown:  Choose either of the below options and construct an appropriate display using boxplots (or box-and-whisker plots), making sure to use appropriate labeled scales on your display.
  • The State of Kansas v. MATH 225, et al: Construct a boxplot for our data set on the same set of axes as a boxplot for the “theoretical distribution” for our target population (what the boxplot would look like if license plate numbers were evenly distributed statewide).
  • Comparative Boxplots:  On the same set of axes, sketch a boxplot for our data set as a whole, as well as an individual boxplot for each individual’s data in the class (and thank your lucky stars that the class size was manageable for this task, instead of a class of 30 people).  For anonymity, it would be best to label individual’s as “Student 1, Student 2, Student 3” instead of using individual’s names.

Of course, if students elected to include all three of these elements, I made sure to grade accordingly, but warned them about the use of space on their poster and how they would balance the space.  One place where students commonly lost points was for lack of labels on their diagrams because they did not take enough due diligence with Excel to correctly format labels (or they just made sure to cut them off and hand-write them correctly in place).

Picture
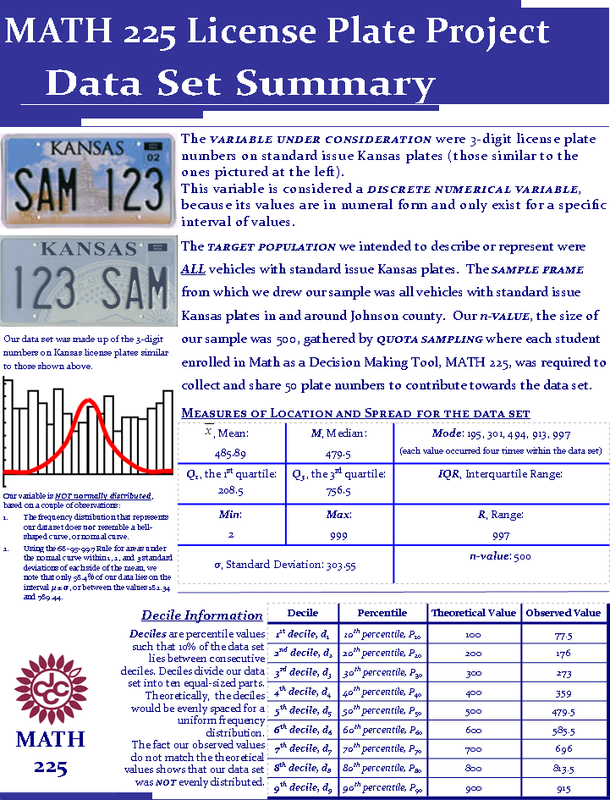
The sample summary page I created.
While I'm certain there are inconsistencies in the language used from one Statistics course to another, I feel it critical to give insight to the required elements students were to include in their poster project submissions.  Here goes: 
  • The variable under observation (where did our data come from)
  • Classify it as a Numerical or Categorical Variable, as well as whether it is Discrete or Continuous, if necessary.
  • The target population
  • The sampling frame
  • The sampling method
  • The N-value, n-value in our case (since we only used a sample instead of the population of plates)
  • The measures of location for the data set (mean, median, and quartiles, as well as the mode, if it exists)
  • The measures of spread for the data set (including the range, interquartile range, and standard deviation)
  • A 5-Number Summary of the data set (this does not have to be included all in one place, but as long as all five values are identified somewhere on the project, that is acceptable)
  • Identify the deciles of the data set (10th, 20th, 30th, 40th, … 90th percentiles).
  • A short description as to whether the variable is normally distributed and what indicator(s) led you to your conclusion.  Most importantly, a reference to whether a bar graph for our data is mound-shaped (bell-shaped) would be an acceptable argument as to whether the data is normally distributed overall.
Throughout the course, I was able to incorporate technology tools to help display statistical concepts and have students' attention since they had seen my use of those displays as elements of my demonstration project.  Their focus on implementing technology was far from passive and this did a lot for class engagement.

Picture
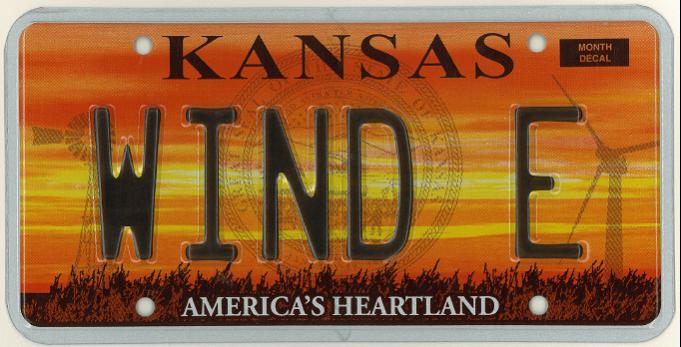
The plate I received from the State Department of Revenue, after bragging up this lesson.
One of the best payoffs of this lesson was in the midst of my quest to acquire an educational wind turbine on our high school's campus, as the state of Kansas changed the artwork in the background of the personalized license plates issued.  A sunset over a wheat field cast out silhouettes of an old-fashioned windmill customary to our state on one side and an industrial-sized wind turbine, as is becoming commonplace in many parts of Kansas.

What a great time to seek out a sample license plate to help introduce this project in class, showing just what 3-digit numbers students were to collect! I enthusiastically contacted the State Department of Revenue (do a Google search to see how many results you have for that phrase; I'm pretty sure I just broke the shutout on that search) to see the potential of getting a default "SAM 123" plate or similar plate being available.  I had seen in the past where demo copies of such plates were available for $7-$12; a nominal fee, I felt, for a great lead-in to this project.

To my surprise, the response I received was more than supportive, being met with enthusiasm that rivaled my own to the tune of "SURE! Actually, since you are using the plate for educational purposes, let us know what you'd like it to say, and how many copies of it you would like to be sent to you.  Oh, and we'll do it at no cost, too!" Forgive me for paraphrasing the Department of Revenue's response.  I hesitantly requested four plates (one for myself, my building principal, assistant principal, and district superintendent) saying "WIND E" to correlate with the WIND E CITY logo I had been using along with all the wind turbine application documents I'd created.

Picture
Original artwork created by Garrett Cleveland, EHS Class of 2012.
So, armed with the support of the state Department of Revenue and enthusiasm and curiosity oozing from the majority of my students, I recommend this project to any teacher whose state happens to have a license plate format that permits its incorporation into their classes.  

I have modified it to use with my high school students with convenience sampling, using all the cars in our high school parking lot, using Google Earth to assign them cars from a certain "zone" of the parking lot within their particular class period.

WORD OF CAUTION: If using this with your students, supervision can become an issue.  My campus was small enough I could supervise all students from one location, but this could leave you open to having your responsibility and classroom management stretched and highly visible in an outdoor environment.

Please let me know your comments, suggestions, critiques, and curiosities towards this project.  I enjoyed putting it together, and equally enjoy sharing it with others.

--Keltner--

 
This game is a long-lived tradition I picked up in college in a Math Methods class. Rules and explanations (even a video demonstration) are included below. I hope you enjoy.
Picture
A screenshot of the Beat the Teach game board.
Rules of Play:
  1. Divide the class into two teams (boys-vs.-girls, teacher-vs.-all, sophomores-vs.-freshmen, etc.). Select a team to go first.  I usually ask around to find which team has the member with the next closest UPCOMING birthday, just because it's fun to get students talking to start the game.
  2. Two coins (or similar markers) are used to select two numbers at the top of the game board.  Both coins may lie on the same value, if chosen. Multiply the selected numbers and place a marker on the appropriate cell on the game board below.
  3. Once a cell on the game board is covered, it cannot be re-covered.  The team with the next play may move one or the other coin at the top, but NOT BOTH coins.  They multiply the two selected values and cover the corresponding value below with their color chip/marker.
  4. Game play continues in this manner until one team gets four of their colored markers in a row either horizontally, vertically, or diagonally.


The benefits I see in this game is that students are not only referring to "multiples of" the values at the top of the playing board, but also looking below to see where they can block their opponent and gear their choices around NOT leaving a factor that can be used to their opponents' benefit.  In my experience, students can develop a pretty fierce rivalry in this game, which is fun to have in a math classroom from time to time.

Beat the Teach game template (PDF format)
Beat the Teach game template (.notebook format for SMART Notebook software) 

If you have questions, comments, or need clarification on this game, please post something in the Comments.

This has become a tradition between my students and me for many years and quickly becomes a class favorite.

--Keltner--
 
Picture
A photo of a public service event when I was a City of Eudora firefighter.
The origins of my blog's name begins from my college days, where I chose to join the volunteer fire department in town rather than join an on-campus fraternity (a fraternity of a different sort, if you will, because of the brotherhood among firefighters).

One of my fellow volunteer firefighters, who also served as the department chaplain, invited all the full-time paid and volunteer firefighters to his church for a recognition ceremony one Sunday and his message that day included a phrase that has stuck with me to this day.  So much so that I used it as the basis for the graduation speech I gave for the Eudora High School graduating class of 2012 in the video below (full script of the speech available here).  
That phrase was "You guys are good for nothing."

Imagine how much attention that phrase grabbed at graduation.  (I also later stated how I look forward to someday buying drugs from a student, then clarified by noting he was majoring in Pharmacy once he graduated high school) Here's he rest of the story, clipped from my graduation speech:

About a year into the volunteer firefighter experience at Emporia, the chaplain for the department issued an invitation to all full-time and volunteer fire department staff, as sort of a recognition for the job they do, hosted at his church near the fire house.  Part of his message included the notion that firefighters consciously see people running out of a dire situation and immerse themselves in it, be it a bicycle wreck or a house fire.  He used a phrase in his message, citing that “volunteers are good for nothing,” hinting that volunteers do good deeds with no incentive presented to them beforehand. Hence, “good for nothing” as this pastor had indicated meant “to potentially do great things with no expectation of recognition or reward.” 

Pardon the sound quality in the video below.  I'll post a better version when I get a chance, but wanted to get my post done and caught up on things.  See second paragraph above for the speech's URL, if interested.

I repeatedly referred to the graduating seniors as "good for nothing kids" from the numerous experiences I had with them where they put forth great effort and character with no expectation of recognition or reward. Here, just a couple examples I used in my graduation speech:
  • When I asked students to volunteer time with Habitat for Humanity, helping build a house in Lawrence, intentionally failing to mention a start time of 7 in the morning on a Saturday, there were numerous willing volunteers.  Even after mentioning how early it would begin. 
  • Volunteers needed for the Ironman Kansas Triathalon? No problem.  100+ degree weather? Cool. When do we start?
  • When I brought up the idea of installing a wind turbine on our high school’s campus, you guys were just sophomores and you wanted to help (check out the time-lapse video of the wind turbine's installation HERE). You showed up at City Hall. You filled two rows to support the cause (the Kansas City FOX News affiliate has a story prior to the turbine's installation available to view HERE).  After the Planning Commission voted to approve the project, the chairperson spoke to you and said he was ready to sign any forms you needed to get extra credit for your Government or Civics class.  And here’s the cool part: to the amazement of the City Planning Commission members, none of you stepped forward to get your extra credit. You weren’t  there that day to get something for yourself. I didn’t say this at the time, but I’ll tell you this now. I was proud of you guys. You came just to support the cause, you good for nothing kids. 
  • I was approached by students from Mr. Robinson’s Video Editing class to help with a public service announcement about how texting in class is unacceptable. This was the most creative way to get a teacher tackled by a student I’ve ever seen (watch their video by clicking the link HERE).  I fell for it...three times.  So, by association, you made me good for nothing, except a little soreness from landing against a light switch.
  • When KDOT wanted to unveil their Airspace Analysis Tool, a brainchild of Mr. Ed Young from Eudora, it took place on a Friday when students were not supposed to be at school anyway--a teacher inservice day.  When I asked for volunteers to come in and offer feedback to the KDOT folks about how the software looked and acted, I almost had to find more desks.  The media staff (Lawrence Journal-World story available HERE) commented numerous times about how great my students were when they didn’t have to be at school at all.
  • I casually showed a handful of students a picture of a Sierpinski triangle made out of pennies and mentioned how our school had done coin drives in the past. They run with the idea and managed to get over $250 raised in three days! Not stopping there, they “burdened” me with having to track down $600 in pennies so we could beat the known record for such figures (NINE times the pennies of the previous record).  With all the proceeds benefiting the March of Dimes, these students incorporated teamwork, charity, and a killer math lesson in one fell swoop.  No banners were hung up to recognize their efforts and the folks with Guinness World Records seemingly shrugged their shoulders to find a record that compared to what we had achieved, for an activity where a collection of students showed up to begin work at 4 IN THE MORNING with no incentive given (watch the time-lapse video of the project HERE). 
  • A couple weeks ago, I came back to school at 8:30 in the evening, only to cross paths with Garrett Cleveland, who said he was working on a new sculpture in the Art room.  The League Art Contest was earlier that week, so there was no chance of him receiving any recognition for this project, nor would he be the cunning type to pull off an elaborate senior prank and use art as an alibi.  Garrett, you exemplify a good for nothing kid.
  • Tara Miller has long been known among staff members as an incredible photographer, actress, and artist, having her work used literally across the nation from photos she has taken at school events and activities.  For so long, she exemplified a good for nothing kid in that she was never paid for her work.  This past Tuesday, she showed me her first paycheck for taking photographs.  I’ve known it for a while, but that check finally showed that Tara Miller can be good for $omething and actually get paid for doing something she excels at. 

I have had teachers before who made an impact on me, nonchalantly leading me down the career path I'm on now.  Experiential learning is something that is hard to replace, or duplicate for that matter, no matter how vividly a teacher is able to describe the scenario.  Students really DO learn best by DOING. To that end, I find it vital to seek out fun, engaging activities for them to participate in as part of my classes as well as the groups I sponsor.
Picture
Click logo for the EFD's Facebook page.
I realize now this post ran on much longer than I intended, but it lends a lot of insight into why I enjoy my job.  My students are truly remarkable, so I take a chance to brag them up whenever I can.  Please forgive the quality of the video above.  I will replace it whenever I find a better method to capture the clip. 


Personal Pride Plug: In my speech, I also managed to work in the phrases "one fell swoop" and "save for a vague recollection," and the words "perspicacity" and "wherewithal." 

Similar to my days with the fire department, I strive to offer good services, lessons, tips, and stories through my blog.  Well, I'm not saving any lives through a blog, but the intent of doing good deeds with no respect of being paid back is still ingrained in what I'm doing here.

So, here's hoping you are able to contribute something to your students or colleagues that is good for nothing.  Sure, it doesn't sound very rewarding, but if teaching was about the extrinsic rewards, it wouldn't be the same gig now, would it?

--Keltner--

 
Picture
9 years teaching, 2 shirts.
The collection of staff ID badges included here happens to be one of my students' favorite #anyqs and they cheer me on from year to year to maintain the constant, if you get my drift.  


This also comes in handy when a student inevitably asks "So, what does a set look like if a small standard deviation exists?"


So, why the subtle differences among the images?  My first year of teaching, I knew staff ID photos would be taken, but wanted to wear something comfortable for the back-to-school staff inservices. Blue striped polo? Perfect.


The following year, I overlooked the previous year's ID shirt and coincidentally wore the same shirt as the previous year. 2-for-2? Cool.


My third year of teaching, my wife coerced me into wearing something different, citing that "people will think I don't know how to do laundry if you wear the same shirt all the time." Eh. What's one year in a different shirt hurt? I'd still get inducted into the Hall of Fame with a .667 average.


And so it went, year after year, reverting to Old Blue for staff ID photo day.  Granted, this #Made4Math project took some time to accumulate the punchline, but has been a fun tradition for my students to cheer me on from year to year, almost like a recurring inside joke they are part of.


Funnier still is the fact the shirt still fits, and that it hasn't worn out.  But, I guess that's what you can expect when it only gets worn once a year.


I know this post isn't very creative or insightful, but hopefully it is good enough for a light chuckle at my expense.  Laugh it up.


--Keltner--

 
Picture
While a graphing calculator is not listed as a necessary school supply in the school district where I teach (and we do not require them for students in our classes, either), it can become a vital piece of equipment that contributes toward student success in math and science.

[About the picture at left (taken in the fall of 2010), my wife swears I am raising nerds as daughters, but also gets some sort of appreciation out of the amount of technology they are able to navigate and utilize.  I heard her yell from living room to bedroom yesterday "How do you girls know how to use your father's iPad anyway?"]

I incorporate technology use on graphing calculators on a regular basis, making sure to give detailed instructions while also using the TI-SmartView software for the TI-84 Family of Handhelds.  I also utilize a TI-Navigator system that was acquired at no expense to our district, when another school had transitioned to a different model of handheld and no longer had use for it. With the use of a SMART Board, I am able to troubleshoot issues on student handhelds on the fly with minimal interruption of class flow.

What I wanted to share on this post were a couple ways I have advocated for students to acquire their own graphing calculator or handheld.  Enter, my back-to-school bulletin board argyle pattern made up of all the graphing calculator models I have ever taught from.  The photo below is only the background, the main part of the display is all the "dead" calculators with broken screens, mangled keypads, or any other debilitating condition which leaves them out of rotation among regular class use.  In nine years of teaching, none of these items have ever been taken, mishandled, or defaced by students.  Call it a mini-museum of sorts (nothing compared to the Museum of Mathematics in New York), but not bad for an amateur like myself), but it definitely lets students handle older versions of handhelds, piquing their curiosity and leading to all sorts of "What can it do?" moments.

Picture
Models included in this bulletin board background pattern, all of which I have taught from at some point:
  • TI-83
  • TI-83 Plus
  • TI-84 Plus and Silver Edition
  • TI-86
  • TI-89 Titanium
  • TI-Nspire Clickpad (Numeric and CAS)
  • TI-Nspire Touchpad (Numeric and CAS)
  • TI-Nspire CX (Numeric and CAS)

The background file is available here (in PDF and XLS formats)
The title file I use, "Calculators that Work", is available here (in PDF and XLS formats)
Feel free to reuse any of these for your own classrooms/hallways.

Picture
Here's a glimpse at the assembly line of the two-page pairings that produced the argyle-ish background for this board. I was able to trim down any overlap on the top and left edges of the images by using a large paper cutter at school, then tucking under any white edges still visible on the right sides to make sure "dead space" stayed to a minimum.

Picture
Just because I don't require a graphing calculator of my students doesn't mean that I can't adequately inform their parents of what options are available in our area.

The way I do this is to produce a handout each year around Open House time to show parents what stores and prices are in our area for graphing calculators they will use in our building's science and math courses.  

As of Tuesday, August 7, 2012, HERE is the latest copy of that handout I have produced; I called it "FYI's about T.I.'s" since the models I tend to recommend are by Texas Instruments. I also serve as a T^3 Regional Instructor on their behalf, providing professional development involving the use of some of their products in math and science classes. Please copy it if you wish, or just use the pricing comparison to help compile a similar handout of your own.

It becomes comical to me how many students wind up, by winter break or graduation time, will ask their parents for a graphing calculator as a gift in lieu of the latest gaming system, cell phone, or MP3 player.  It definitely makes me think I've done something to get them interested in math.

UPDATE (8/9/2012):  If the attached files above are coming out a bit funny, let me know.  When I attempted one, it came out with several blank pages in Print Preview, mainly because the text boxes "reserve" space above and below the visible lettering  Below is a photo of this year's final product.  Please let me know your thoughts and comments, even suggestions because I realize now I used a LOT of black and white so suggestions on splashing color would be helpful (in retrospect, I probably used black and white out of respect for the "dead" calculators used as exhibits on this mini-museum).

Picture
(Follow me on Twitter, username @ScottKeltner, if interested.) 

--Keltner--